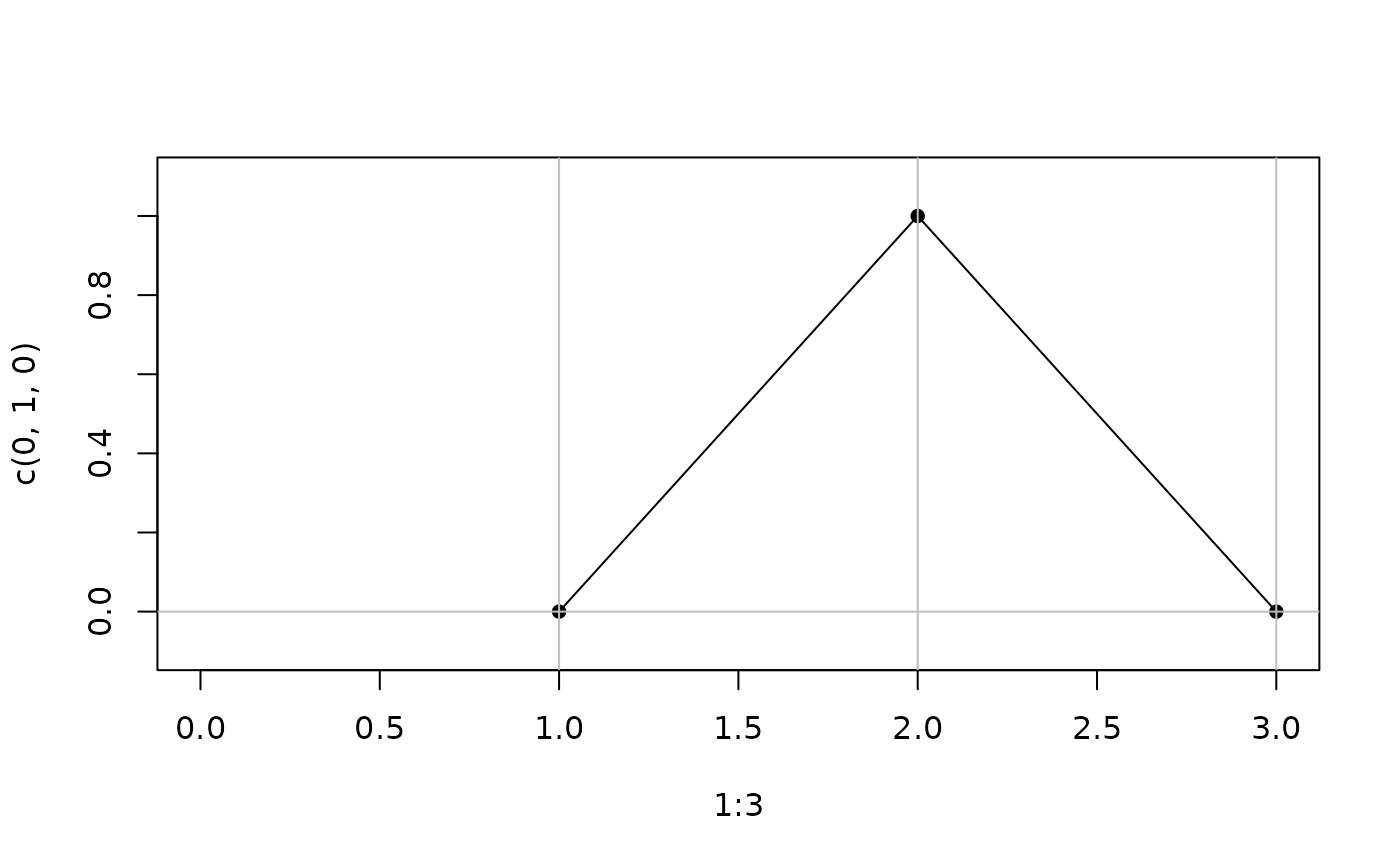
Function to generate images of sampled waveforms with shapes analysed by Time Domain Signal Coding.
Usage
sample_waveform(
  samples = 3,
  fig_max_samples = NULL,
  start_zero = TRUE,
  invert = FALSE,
  tdsc_shapes = FALSE,
  limit_y = TRUE,
  ...
)
Arguments
- samples
The number of samples
- fig_max_samples
When constructing multiple figures this parameter can be used to ensure the plots are of the same size and are aligned
- start_zero
If TRUE the waveform starts at zero, if FALSE the zero crossings are between samples
- invert
If TRUE the shapes are positive with positive minima, if FALSE shapes are negative with negative maxima
- tdsc_shapes
If TRUE the shapes correspond to TDSC shapes, if FALSE they resemble sampled sine waves
- limit_y
If TRUE the shape fills the plot, if FALSE the complete range of the y axis is plotted (-1 to 1).
- ...
Further arguments to pass to plot.